RSI Precision (Free TA Indicator)
RSI Precision is an advanced version of the classic Relative Strength Index (RSI), designed by Giorgos Protonotarios. This free tool, available on TradingView, combines traditional RSI readings with key technical analysis (TA) signals, offering a more accurate oscillator that works across different market conditions.
What Makes RSI Precision Unique?
RSI Precision enhances the classic RSI by integrating price volatility and momentum into the readings, resulting in more precise insights, especially during volatile or choppy market conditions. This makes it an ideal tool for analyzing highly volatile markets, such as cryptocurrencies and equities.
What’s New in RSI Precision 2.0?
The second version of the RSI Precision includes additional features to further refine your trading decisions:
-
MACD Signals (•) – New to this version
-
SMA Signals (x) – New to this version
-
RSI Signals (▲▼) – Continuation of the original feature
These added signals enhance the overall functionality and allow for more comprehensive market analysis.
► Add RSI Precision 2.0 for free on TradingView.com; it is 100% free. » https://www.tradingview.com/script/kBpWBCXU-RSI-PRECISION-MACD-SMA-Signals/
What’s New in RSI Precision 3.0?
The third version, RSI Precision 3.0, offers even more advanced features to optimize your trading:
-
Selected StochRSI signals
-
Low-timeframe (<60 minutes) & high-timeframe SMA signals (>60 minutes)
-
SMA on RSI Precision readings
-
Full customization options via the 'Settings' menu, including added tooltips for ease of use
► You can access and add RSI Precision 3.0 for free on TradingView here: » https://www.tradingview.com/script/cTEWnHdU-RSI-PRECISION-v-3/
As shown in the following chart, RSI Precision provides remarkable breakout signals, enabling traders to spot potential price movements early and accurately.
Chart: RSI Precision on Bitcoin

RSI Precision Formula
The RSI Precision formula is made up of three distinct modules:
-
Relative Strength Index (RSI) Readings
-
Price Volatility Module
-
RSI Volatility Module
You can easily customize the formula through the Settings menu.
Basic Settings Overview
When you click "Settings," you’ll find several adjustable parameters for a more tailored experience:
-
RSI Periods: Default is 14
-
RSI Precision Formula
-
RSI Factor (%): Default 100%
-
Periodic Price Volatility (%): Default 100%
-
RSI Volatility (%): Default 5%
-
-
RSI Crossover/Crossunder Levels: Default is 5 for bullish crossover, 100 for bearish crossunder
-
Periods for SMA Crossovers: Default 50 periods for fast SMA, 200 for slow SMA
Key Objectives of RSI Precision
-
Identify Overbought/Oversold Levels
Get clear, accurate signals for overbought or oversold conditions in an intuitive format.
-
Precise Calculations Near Market Tops and Bottoms
Make well-informed decisions during high volatility, where price movements are at their most dramatic.
-
Accurate Readings on Longer Timeframes
RSI Precision offers more readable and reliable results for monthly and weekly charts, where standard RSI often lacks clarity.
-
Three Types of Trading Signals
The tool provides RSI, MACD, and SMA signals to give you multiple perspectives for informed decision-making.
Add RSI Precision for Free
You can add RSI Precision to your TradingView charts for free here: » https://www.tradingview.com/script/kBpWBCXU-RSI-PRECISION-MACD-SMA-Signals/
 □ RSI Precision
Coded by Giorgos Protonotarios, Financial Analyst
for Qexpert.com (June 2023)
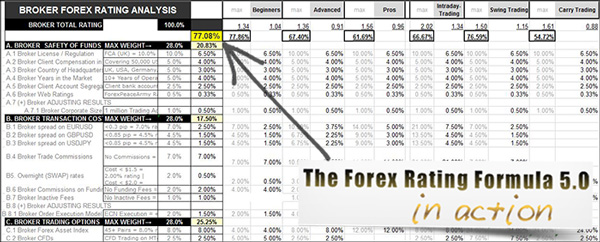
MORE: ► Financial Books | ► The Forex Rating Formula | ► TCI System | ► PriceMomentum: New Chart Type