![]()
PriceMomentum on Eurodollar, Gold, and Bitcoin
PriceMomentum is a revolutionary chart type that enhances traditional price action by incorporating additional market features. This helps traders identify the true dynamics of supply and demand, as well as key levels of support and resistance.
Introducing the PriceMomentum Chart
Developed by George Protonotarios, PriceMomentum is an innovative chart type that offers a fresh perspective on chart analysis, allowing a deeper understanding of historical price movements. The PriceMomentum algorithm is designed to calculate price changes alongside market volatility and shifts in periodic price momentum. In its initial version, data is calculated on a daily basis.
PriceMomentum Algorithm
The PriceMomentum algorithm consists of three main components:
- Price Change (%)
- Intraday Volatility (%)
- Price Momentum Shifts (calculated on an intraday basis)
Features:
- The PriceMomentum chart focuses on daily percentage gains and losses, rather than the price itself.
- It combines price changes, intraday momentum, and intraday volatility for a more comprehensive view.
- The chart uses a logarithmic scale, similar to a logarithmic chart, but integrates additional data for enhanced precision.
- More accurate than standard line or logarithmic charts, especially near key market tops and bottoms.
- Extremely sensitive to price momentum shifts, particularly during significant volatility (which is common near market extremes).
Usage:
- The PriceMomentum chart can be applied to any asset class and timeframe (currently, it is used on the daily chart).
- Traditional technical analysis formations and chart patterns can be identified on a PriceMomentum chart.
- Moving averages are fully applicable.
- Ideal for analyzing long-term trends in volatile markets where regular price charts often fail to capture the full price action.
- Identifies trend exhaustion long before it can be spotted on basic price charts.
- Market tops and bottoms are typically evident on the PriceMomentum chart before they are visible on standard price or logarithmic charts.
- Can identify historical support and resistance levels, draw precise trendlines, and detect significant channels (as demonstrated with EURUSD).
PriceMomentum on Eurodollar (EUR/USD)
In the following example, PriceMomentum is applied to the Eurodollar (EUR/USD), the most liquid forex asset.
Chart: PriceMomentum on EUR/USD
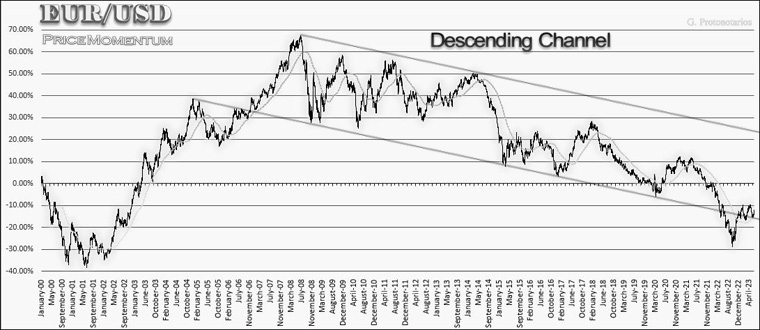
- The grey line represents the SMA(100). When EUR/USD crosses above or below the SMA(100), the trend gains momentum.
- A clear descending triangle has formed over the years.
- Upon breaking the channel in 2022, EUR/USD sees a significant decline.
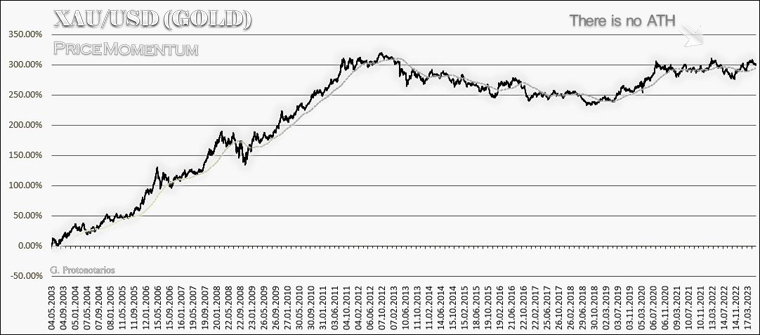
PriceMomentum on Gold (XAU/USD)
The following PriceMomentum chart shows that, since 2012, Gold has not reached a new all-time high (ATH). Interestingly, while a new ATH appeared in 2020 on a standard price chart, it is absent in the PriceMomentum chart, as shown below. This also includes the SMA(100) for further analysis.
Chart: PriceMomentum on Gold
PriceMomentum on Bitcoin (BTC/USD)
The PriceMomentum chart is particularly effective for analyzing volatile markets such as Bitcoin (BTC/USD).
Chart: PriceMomentum on Bitcoin/USD (Upper) & Bitcoin's Logarithmic Chart (Lower)

By analyzing the PriceMomentum chart of BTC, we observe that the three Bitcoin market cycles have followed remarkably similar patterns. Notably, the PriceMomentum chart often forms a new all-time high long before the price chart does, showcasing that price momentum shifts precede actual price movements.
Using the PriceMomentum Chart to Identify the Start of Bitcoin's Bull Markets
PriceMomentum can also be used to identify the beginning and end of a Bitcoin bull market:
(A) Start of the Bitcoin Bull Market
When BTC crosses above the SMA(100) on the PriceMomentum chart and simultaneously forms a new high, it signals the beginning of the Bull Phase (which typically occurs once every four years).
(B) End of the Bull Market
After the Bull Phase begins, the first time BTC crosses below the SMA(100), the Bull Phase is considered exhausted. Notably, over the next six months, BTC may attempt to form a new high, but once this second attempt fails, the market will enter the Bear Phase.
![]() ■ PriceMomentum: A Brand-New Chart Type by Giorgos Protonotarios
■ PriceMomentum: A Brand-New Chart Type by Giorgos Protonotarios
G. Protonotarios, for Qexpert.com, June, 21st 2023
Originally published on TradingCenter.org (c)
MORE: ► Financial Books | ► RSI Precision (enhanced RSI) | ► TCI System | ► The "Rating Formulas" Series