Introduction to the TCI Technical Analysis System by Qexpert.com
TCI stands for “Trading Center Indicator.” It's a technical analysis system designed to detect price trends in any financial market, developed by George Protonotarios for TradingCenter.org.
TCI Works in Any Market, On Any Timeframe
 One of TCI’s key strengths is its ability to analyze any financial asset or market—such as Forex, stocks, indices, bonds, or commodities—across all timeframes.
What makes this possible? Human psychology. Price movements in any market are heavily influenced by patterns of human behavior, which often repeat. This leads to market extremes—overbought and oversold conditions—that TCI is built to detect.
The Role of Psychology: Technical vs. Fundamental Analysis
Fundamental Analysis Rules the Long Term
In the long run, asset prices reflect fundamental factors—things like interest rates, inflation, earnings, or political risk. These core elements shape the "real" value of currencies, stocks, or bonds. Over time, markets tend to reward solid fundamentals.
But in the short term, markets often behave irrationally.
Technical Analysis Dominates the Short Term
Short-term price movements can be chaotic. Sudden news, regulation changes, or tech shifts can disrupt markets. During such times, fundamentals may not reflect reality, and prices swing wildly.
For instance, during the Dot-Com bubble in 2000, tech stocks with little revenue were valued at extreme multiples (P/E ratios of 400 or more). Markets had lost touch with reality—a classic case of short-term irrationality.
That’s where technical analysis, and TCI in particular, becomes essential. TCI is designed to track and interpret these emotional market swings.
Image: TCI on Google Share (TCI-Long spots an uncommon pattern)

How TCI Works -Structure Overview
The Core Formula (2 MAs)
At the heart of the TCI system are two specialized moving averages, built using detailed price data (open, high, low, close, and volume):
-
Moving Average A: Calculates core daily valuations
-
Moving Average B: Refines those results with corrective adjustments
Together, they generate daily values that help spot overbought or oversold conditions and uncover hidden patterns in price behavior.

Analyzing the TCI Historical Results/Forecasts
TCI generates daily valuations that may indicate the overbought/oversold levels of any financially traded asset at any given time. Based on the row of TCI results, excellent charts may be displayed. Furthermore, TCI is able to recognize the general time pattern and indicate the perfect timing for executing a trade. The time pattern recognition includes local highs/lows and high-probability trend reversals.
TCI helps answer two critical questions for traders:
-
Is the asset overbought or oversold?
-
When is the ideal time to enter or exit a trade?
It does this by analyzing past data to identify patterns and then projecting forward to predict turning points in trends—both highs and lows.
Looking Backwards and Forwards –What TCI Forecasts Reveal
TCI’s standout feature is its dual-direction analysis:
-
Looking backward: Identifies what asset is at an extreme (WHAT)
-
Looking forward: Predicts the best time to act (WHEN)
“Looking backward to spot trading opportunities, and forward, to decide the right time to act”
TCI Key Features
-
Analyzes daily price data (including closing prices, pivots, and volatility)
-
Uses two-layered moving averages with advanced sub-formulas
-
Works on any asset class (stocks, currencies, bonds, commodities, etc.)
-
Fits any timeframe, using the Fibonacci sequence for scaling
-
Can be used for both historical and future analysis
-
Generates custom charts for any period
-
Offers clear and actionable trading signals
TCI v1.2: Evolving with the Markets
Markets evolve—and so does TCI. With version 1.2, the system now includes two separate tools:
-
TCI Long: Analyzes long-term trends and cycles
-
TCI Short: Focuses on short-term swings to fine-tune trade timing
In times of high market volatility, shorter timeframes become more relevant—TCI adapts accordingly.
Backtesting TCI: Key Insights
From historical testing, here’s what we’ve learned:
-
TCI is more reliable on high-volume assets than low-volume ones
-
During major market shifts, TCI Long is more effective than TCI Short
-
It performs better with currencies and indices than individual stocks
In the following example, when TCI for GBP/USD drops near -10%, the market is highly oversold.
Image: TCI reaches -10%, indicating an oversold GBPUSD market

TCI Signals on TradingCenter.org
TradingCenter.org regularly publishes signals based on TCI. These signals cover a wide range of markets—Forex, commodities, indices, and popular stocks.
High-volume, widely traded assets are preferred because they provide better data quality and lower transaction costs.
![]() ■ Giorgos Protonotarios, Financial Analyst
■ Giorgos Protonotarios, Financial Analyst
For Qexpert.com (c)
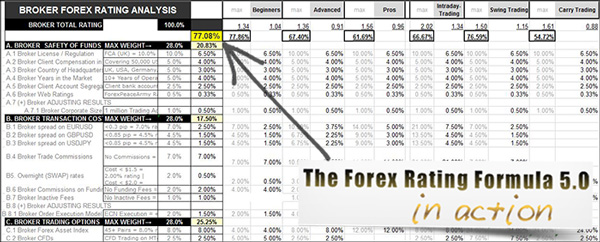
MORE: ► Financial Books | ► RSI Precision (enhanced RSI) | ► The Forex Rating Formula | ► PriceMomentum: New Chart Type