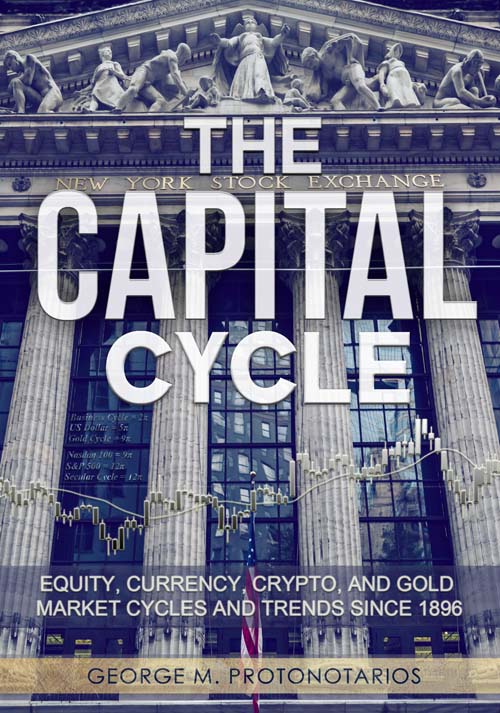
 THE CAPITAL CYCLE
- Subtitle: Equity, Currency, Crypto, and Gold Market Cycles and Trends Since 1896
- Author: George M. Protonotarios
- Language: English
- Number of Pages: 161
Description:
The ‘Capital Cycle’ explores the trends and recurring patterns of the global economy and financial markets since 1896. The book seeks to uncover order amid economic chaos and structure within the apparent complexity of financial markets. While every investment carries a high degree of uncertainty, an educated bet remains far superior to a random walk.
🔗 Buy the PDF version on Payhip | 🔗 Buy the ePub version on Amazon
- TABLE OF CONTENTS -
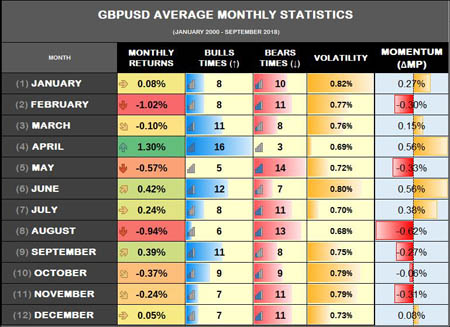
This book aims to provide a comprehensive analysis of economic and international market cycles, emphasizing the duration of each. Understanding the average length and starting point of these cycles enables investors to estimate when they are likely to conclude. There are also important insights in seasonality statistics that may make you question the randomness of financial markets.


