- Details
- Category: Trading Research
![]()
PriceMomentum on Eurodollar, Gold, and Bitcoin
PriceMomentum is a revolutionary chart type that enhances traditional price action by incorporating additional market features. This helps traders identify the true dynamics of supply and demand, as well as key levels of support and resistance.
Introducing the PriceMomentum Chart
Developed by George Protonotarios, PriceMomentum is an innovative chart type that offers a fresh perspective on chart analysis, allowing a deeper understanding of historical price movements. The PriceMomentum algorithm is designed to calculate price changes alongside market volatility and shifts in periodic price momentum. In its initial version, data is calculated on a daily basis.
PriceMomentum Algorithm
The PriceMomentum algorithm consists of three main components:
- Price Change (%)
- Intraday Volatility (%)
- Price Momentum Shifts (calculated on an intraday basis)
Features:
- The PriceMomentum chart focuses on daily percentage gains and losses, rather than the price itself.
- It combines price changes, intraday momentum, and intraday volatility for a more comprehensive view.
- The chart uses a logarithmic scale, similar to a logarithmic chart, but integrates additional data for enhanced precision.
- More accurate than standard line or logarithmic charts, especially near key market tops and bottoms.
- Extremely sensitive to price momentum shifts, particularly during significant volatility (which is common near market extremes).
- Details
- Category: Trading Research
Introduction to the TCI Technical Analysis System by Qexpert.com
TCI stands for “Trading Center Indicator.” It's a technical analysis system designed to detect price trends in any financial market, developed by George Protonotarios for TradingCenter.org.
TCI Works in Any Market, On Any Timeframe
 One of TCI’s key strengths is its ability to analyze any financial asset or market—such as Forex, stocks, indices, bonds, or commodities—across all timeframes.
What makes this possible? Human psychology. Price movements in any market are heavily influenced by patterns of human behavior, which often repeat. This leads to market extremes—overbought and oversold conditions—that TCI is built to detect.
The Role of Psychology: Technical vs. Fundamental Analysis
Fundamental Analysis Rules the Long Term
In the long run, asset prices reflect fundamental factors—things like interest rates, inflation, earnings, or political risk. These core elements shape the "real" value of currencies, stocks, or bonds. Over time, markets tend to reward solid fundamentals.
But in the short term, markets often behave irrationally.
Technical Analysis Dominates the Short Term
Short-term price movements can be chaotic. Sudden news, regulation changes, or tech shifts can disrupt markets. During such times, fundamentals may not reflect reality, and prices swing wildly.
For instance, during the Dot-Com bubble in 2000, tech stocks with little revenue were valued at extreme multiples (P/E ratios of 400 or more). Markets had lost touch with reality—a classic case of short-term irrationality.
- Details
- Category: Trading Research

RSI Precision (Free TA Indicator)
RSI Precision is an advanced version of the classic Relative Strength Index (RSI), designed by Giorgos Protonotarios. This free tool, available on TradingView, combines traditional RSI readings with key technical analysis (TA) signals, offering a more accurate oscillator that works across different market conditions.
What Makes RSI Precision Unique?
RSI Precision enhances the classic RSI by integrating price volatility and momentum into the readings, resulting in more precise insights, especially during volatile or choppy market conditions. This makes it an ideal tool for analyzing highly volatile markets, such as cryptocurrencies and equities.
What’s New in RSI Precision 2.0?
The second version of the RSI Precision includes additional features to further refine your trading decisions:
-
MACD Signals (•) – New to this version
-
SMA Signals (x) – New to this version
-
RSI Signals (▲▼) – Continuation of the original feature
These added signals enhance the overall functionality and allow for more comprehensive market analysis.
► Add RSI Precision 2.0 for free on TradingView.com; it is 100% free. » https://www.tradingview.com/script/kBpWBCXU-RSI-PRECISION-MACD-SMA-Signals/
- Details
- Category: Trading Research
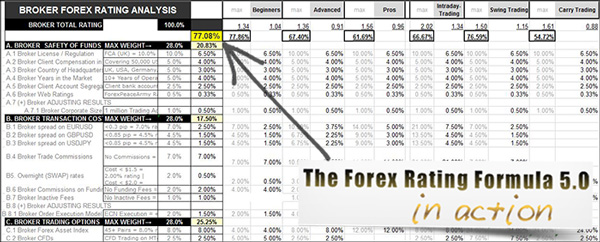
Rating Financial Services -The New Rating Formula 5.0

"Ensuring the safety of trading funds while minimizing transaction costs and gaining access to cutting-edge technology."
Web 3.0 and the Evolution of Financial Ratings
In the era of Web 3.0 and machine learning, financial ratings will not be the same. Users will increasingly define their own criteria to receive tailored ratings for the financial services they seek. In the future, they may not even need to do so manually. Smart systems will generate user profiles and deliver personalized ratings automatically, based on browsing history and behavioral data.
Introducing the Forex Rating Formula v5.0 – The Industry’s Most Advanced Evaluation Tool
The Rating Formula Series, created by financial analyst Giorgos Protonotarios, is designed to revolutionize how financial brokers are rated.
The Problem of Manipulated Online Ratings
When encountering a new financial firm, it’s common practice to search for its rating online. However, studies show that over 50% of online user reviews and ratings are fake. Many corporations pay third parties to write favorable reviews for themselves and unfavorable ones for their competitors. A strong indicator of this manipulation is the prevalence of extreme scores (e.g., 10/10 or 1/10).
On the following example, a major financial firm was shown to have 93% of its 226 reviews rated either 5/5 or 1/5 -that clearly indicates manipulated data.
")
Solution: An Objective, Transparent Rating Framework
The Rating Formula offers a consistent, trustworthy, and objective system for evaluating any brokerage firm. It is built on a 4-factor model, covering key aspects of trading:
-
Safety of Funds
-
Cost of Trading
-
Trading Options
-
Technological Efficiency
At its core is a simple mission:
“Ensuring the safety of trading funds while minimizing transaction costs and gaining access to state-of-the-art technology.”
Read more: Introducing an Objective Financial Rating Framework
Trading Research Gallery